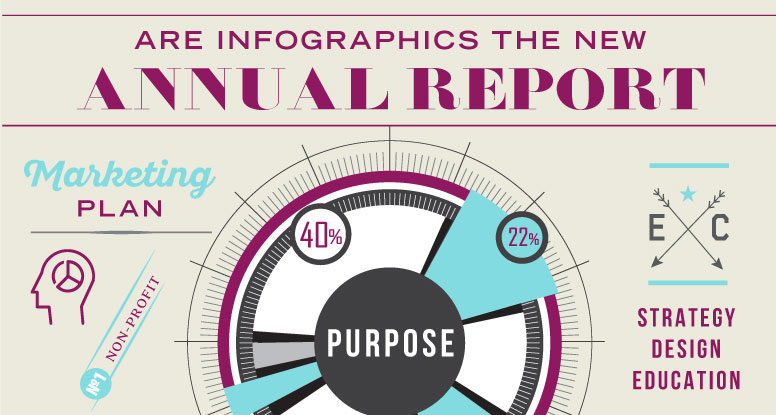
Are infographics the new Annual Report?
Are infographics the new Annual Report?
What do you get if you combine an average reading age of the eighth grade with the short attention span of the modern Internet user? Think of driving past a billboard at 60 miles an hour. That’s how much attention they are paying to your content. How can we engage them? Data shows we humans want bite-sized chunks, real stories, and pretty pictures. As Kivi Leroux Miller, president of Nonprofit Marketing Guide, explains, “Nonprofits are investing way too much time, energy, and money into long, printed reports that no one in their right mind will read.”
If you bore them, they will leave
Almost no one wants to read an introduction from your CEO or see dry facts and figures in pie charts or tables. No one wants long-winded paragraphs. We want to quickly see who you helped and how you did it, and we want to make an emotional connection to make us feel better about supporting you. You’ve already got great data. Dig into it for some fascinating nuggets of information to show off about what you have achieved. Get an experienced designer to visualize your data into infographics and further illustrate with a real story of an individual who benefitted. It’s time to ditch the tedious text and use infographics for your next annual report.
People like pictures
Commissioning infographics to tell the story of your impact as an organization will also save you money and strengthen your brand. You can break up elements and use them across your organization all year, not just at report time. Use them in a blog or social media posts, on your website, and across your marketing materials. They are digital assets that you will then own, and each department, not just marketing, can use them for their work. Look at your planning calendar, think about every campaign and every marketing drive across the year, and commission everything at once. Using the same elements regularly strengthens your brand recognition.
BONUS – FREE ANNUAL REPORT RESOURCE GUIDE Annual Reports can be a powerful communications piece, and we want to show you how. We have put together two pages of tips, tools, and resources to help your nonprofit build a creative and compelling Annual Report.
Download your free guide now
Tips for Success
Try to focus on only 2 or 3 impactful things that happened in the year. You can’t tell people about everything – that’s what leads to very boring reports. To get cooperation, pull a team together with someone from each department to talk about the most amazing things you did last year.
Brief a proper designer if you can afford it. (If you can’t afford it, check out services like Piktochart, Infogram, and Easel.ly)
When you have identified which facts you need to share, use a real story about a person who benefitted from what happened and commission some photography of them.
Check out some examples here
- Hearts and Homes for Youth Infographic
- 4 Steps to Creating Infographic Annual Reports
- Eurasia Foundation Impact Report
- A Great Nonprofit Annual Report in a Fabulous Infographic
- Online Annual Reports/
Need more? Contact us. We can help
Are you tasked with creating an annual report for your organization? We can help. Set up a free 30-minute strategy consult to talk about your Annual Report.
What are your thoughts on using infographics? If you’ve used them, we’d love to hear from you and even see some of your examples. We enjoyed reading the email! Feel free to leave a comment below or complete this contact form.